

 Facebook
 X
X
 Pinterest
 Copy Link
Market Trends 32409 Panama City, Florida
Navigating the Current Real Estate Market in Panama City, FL 32409: A Seller’s Guide
Market Trends: A Shift Towards Balance
Days on Market: A Relatively Quick Turnaround
Pricing Strategies: Room for Negotiation
Median Sold Price: A Benchmark for Sellers
Neighborhood Highlights: What Makes Panama City, FL 32409 Desirable
-
St. Andrews State Park
-
Shell Island
-
Panama City Beach Pier
-
Gulf World Marine Park
-
Pier Park
-
30A
-
Mexico Beach
-
Port St. Joe
-
St. Joe Beach
-
Cape San Blas
Conclusion: Navigating the Shifting Market
READ THE FULL REPORT HERE: 32409 Residential Market Trends – Realtors Property Resource
Listing agent and location for image above, Tabitha Garcia, Century 21 Ryan Realty. Direct: 850-866-4783
https://tabithagarcia.sites.c21.homes/listing/FL/Southport/3052-Rachel-Place-32409/201998958
February Fun in PCB: Top Events and Festivals 2025!
February Events in Panama City and Panama City Beach: Fun for Everyone, 2025!
February is shaping up to be an exciting month in Panama City and Panama City Beach! From thrilling performances to festive celebrations, there's something for everyone to enjoy. Here are some of the top events happening in the area:
Cirque Italia Water at Frank Brown Park, February 7, 2025 - February 10, 2025
Get ready to be amazed by the death-defying acrobats and aerialists of Cirque Italia Water! This spectacular show will be performed at Frank Brown Park from February 7-10, 2025. Don't miss out on the thrilling stunts and mesmerizing visuals!
Panama City Beach Food Truck and Craft Beer Festival, February 8, 2025 - February 9, 2025
Foodies and beer enthusiasts, rejoice! The Panama City Beach Food Truck and Craft Beer Festival is coming to town on February 8-9, 2025. Savor delicious eats from local food trucks and sample craft beers from regional breweries.
Panama City Beach Mardi Gras and Music Festival, February 14-15, 2025
Combine the excitement of an authentic Mardi Gras celebration with the spectacular views of our emerald green water and sugar-white sand, and you're in for a real treat at the Panama City Beach Mardi Gras and Music Festival on February 14-15. In conjunction with the Krewe of Dominique Youx's great Mardi Gras at the Beach parade, the festival features entertainment for the whole family.
St. Andrews Mardi Gras, February 21-23, 2025
The St. Andrews Mardi Gras is returning to Panama City from February 21-23, 2025, with all the colorful floats, lively music, and festive fun you've come to expect from this beloved event. Don't miss out on the parades, parties, and merriment!
Cirque Under the Stars, February 20, 2025 - February 22, 2025
Experience the magic of Cirque Under the Stars from February 20-22, 2025. This enchanting show features death-defying acrobats, aerialists, and other talented performers.
Emerald Coast Boat and Lifestyle Show, February 28, 2025 - March 2, 2025
Mark your calendars and get ready to experience the best of Panama City and Panama City Beach this February!
Market Trends 32407 Panama City Beach Florida
Understanding the Real Estate Market in 32407: A Seller’s Guide
As a seller in the 32407 zip code, it’s essential to stay informed about the current state of the real estate market. In this article, we’ll break down the key metrics that can impact the sale of your home and provide you with valuable insights to help you navigate the market.
Months Supply of Inventory: 9.01
The Months Supply of Inventory is a crucial metric that indicates how long it would take to sell all the homes on the market given the current pace of sales. In the 32407 zip code, this metric currently stands at 9.01. A higher number suggests a buyer’s market, where there is more inventory than demand.
12-Month Change in Months of Inventory: +35.9%
The 12-Month Change in Months of Inventory has increased by +35.9%, indicating a trend towards a higher inventory level compared to the previous year. This could potentially lead to increased competition among sellers and longer days on the market for your home.
Median Days Homes are On the Market: 112
The Median Days Homes are On the Market is 112, which means that, on average, it takes just over three months to sell a home in the current market conditions. It’s essential for sellers to be patient and prepared for a potentially longer selling process.
List to Sold Price Percentage: 96.2%
Despite the longer days on the market, sellers can take comfort in the List to Sold Price Percentage of 96.2%. This metric shows that homes are selling close to their list price, indicating that there is still strong demand for properties in your area.
Median Sold Price: $394,675
The Median Sold Price of $394,675 gives sellers an idea of what similar homes are selling for in the market. Pricing your home competitively is crucial to attracting potential buyers and ensuring a successful sale.
Conclusion
Understanding the current market conditions and trends is crucial for sellers in the 32407 zip code. By staying informed about the key metrics that impact the sale of your home, you can make informed decisions and maximize the sale of your property.
Read the Full Report here: 32407 Residential Market Trends – Realtors Property Resource
Listing agent and location for image above, Tabitha Garcia, Century 21 Ryan Realty. Direct: 850-866-4783 https://tabithagarcia.sites.c21.homes/listing/FL/Panama-City-Beach/170-W-Leslie-Lane-32407/201323510
Market Trends 32408 Panama City Beach, Florida

Understanding Real Estate Metrics: A Seller's Guide
Months Supply of Inventory: 7.17
12-Month Change in Months of Inventory: +39.49%
Median Days Homes are On the Market: 60
List to Sold Price Percentage: 96.2%
Median Sold Price: $540,000
Key Takeaways
-
Understanding the correlations between these real estate metrics can help sellers navigate the market effectively.
-
The current market conditions suggest a more competitive landscape, requiring sellers to adjust their pricing strategy.
-
By leveraging these insights, sellers can maximize their chances of a successful sale.
Read the Full Report here: 32408 Residential Market Trends, Realtors Property Resource
https://jenabuchanan.sites.c21.homes/listing/FL/Panama-City-Beach/525-Wahoo-Road-32408/194162001
Local Market Update for December 2024
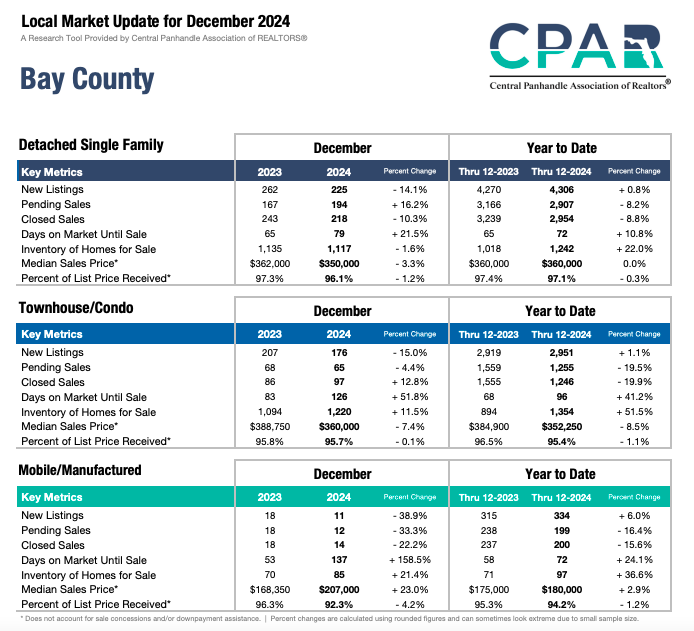
Local Market Update for December 2024
U.S. Existing-Home Sales See Second Consecutive Month of Growth!
The latest numbers from the National Association of REALTORS® (NAR) reveal a 4.8% increase in existing-home sales, reaching an eight-month high of 4.15 million units. This marks a 6.1% year-over-year increase, the largest since June 2021.
Here's a breakdown of the local market:
-
Detached Single Family Closed Sales: -4.2% to 300
-
Townhouse/Condo Closed Sales: +11.8% to 104
-
Mobile/Manufactured Closed Sales: +14.8% to 31
Median sales prices saw mixed results:
-
Detached Single Family: -6.9% to $330,650
-
Townhouse/Condo: -7.2% to $369,500
-
Mobile/Manufactured: +5.7% to $166,000
Inventory remains a challenge, with a 2.9% decrease from the previous month and a 17.7% increase year-over-year. The current 3.8-month supply of homes for sale continues to drive up sales prices nationwide, with a median existing-home price of $406,100, up 4.7% from last year. Stay informed about the latest real estate trends and market updates!
Click Here for the Local Market Update Dec 2024, Bay County
Click Here for Monthly Indicators, Bay County
Maximize Your Home's Value with Local Expertise
To get the best price for your home, it's crucial to understand the unique dynamics of your local market. Our experienced real estate team can provide you with a personalized market analysis to determine your home's accurate value. Avoid the risks of underpricing or overpricing your property.
Contact us today to schedule your market analysis and let us guide you in selling your home for top dollar!


